HomeTown - Network Services Dashboard
Overview
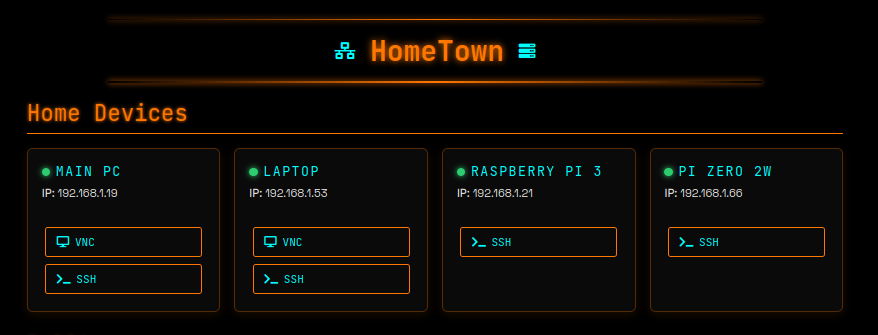
My centralised web dashboard for monitoring and managing the various network services I run, with bonus secure remote access. After building out the Dullbox server with multiple containers, I wanted a single pane of glass to see everything at once. I started with a simple NGINX container, but after reading more about OpenResty, I chose to switch to that.
Core Features
- Device status monitoring - Real-time online / offline detection for the services
- System statistics - Live CPU, memory, and uptime metrics via PHP
- Integrated SSH terminals - Modal-based access using Shellinabox, not really necessary, but I wanted to try having an embedding terminal on the dash
- Remote access - Secured via Tailscale
Technical Stack
- PHP backend - PHP is working nicely for system data collection and SSH
- JavaScript frontend - Real-time updates and interactive interface
- Apache web server - Hosted on Proxmox LXC container
- Custom CSS - Cyberpunk-inspired design with responsive layout - noone is using HomeTown oher than me, so I can make it as pretty or disgusting as I like. The result is a bit of both.
The SSH Integration Journey
Getting web-based SSH access working was trickier than expected. I initially tried WebSSH2, which looked promising, but ran into annoying dependency issues with Node.js packages. After spending an evening debugging broken configs, I switched to Shellinabox. It's a wee bit older, but a rock solid solution that just works.
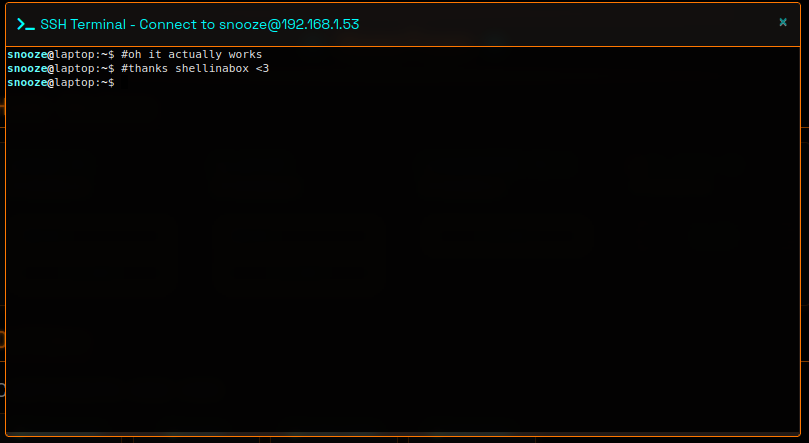
The implementation uses Bootstrap modals to embed the terminal without leaving the dashboard. SSH keys handle authentication automatically, and I've set up aliases for every device on the network, so connecting is as simple as typing pi3 or laptop.
Recent Additions
- SSH access to all network devices through web interface
- Modal terminal windows with device specific aliases
- Automated SSH key management for passwordless connections / better security practice
How It Works
The dashboard pulls all the system stats from Proxmox using a multi layered approach:
- Bash script on the Proxmox host collects the metrics and outputs JSON
- PHP script in the web container SSH's to the host and runs the bash script
- JavaScript frontend polls the PHP endpoint and updates the UI in real-time
Device status monitoring uses simple ICMP pings combined with port checks to verify services are actually responding, not just that the host is up.
Design Philosophy
I initially went full cyberpunk with neon purples and flashing indicators - it looked cool, at least, the 14 year old in me thought it did, but was genuinely painful to use for more than a few minutes. I've since toned it down to a cleaner dark theme with cyan and orange accents. Function over form, even if the form was pretty cool.
Monitoring Integration
After building out a proper observability stack on Dullbox (Prometheus, Loki, Grafana, Uptime Kuma, and Ntfy for push notifications), I wired the relevant bits into HomeTown. Service status now pulls live data from Uptime Kuma, and the Grafana dashboards are a click away from the main dash. It's the same single pane of glass, just with a lot more behind it than when I started. The full stack write-up is in the Dullbox post.
What's Next
- Mobile improvements for phone access